Documentation Index
Fetch the complete documentation index at: https://docs.devic.ai/llms.txt
Use this file to discover all available pages before exploring further.
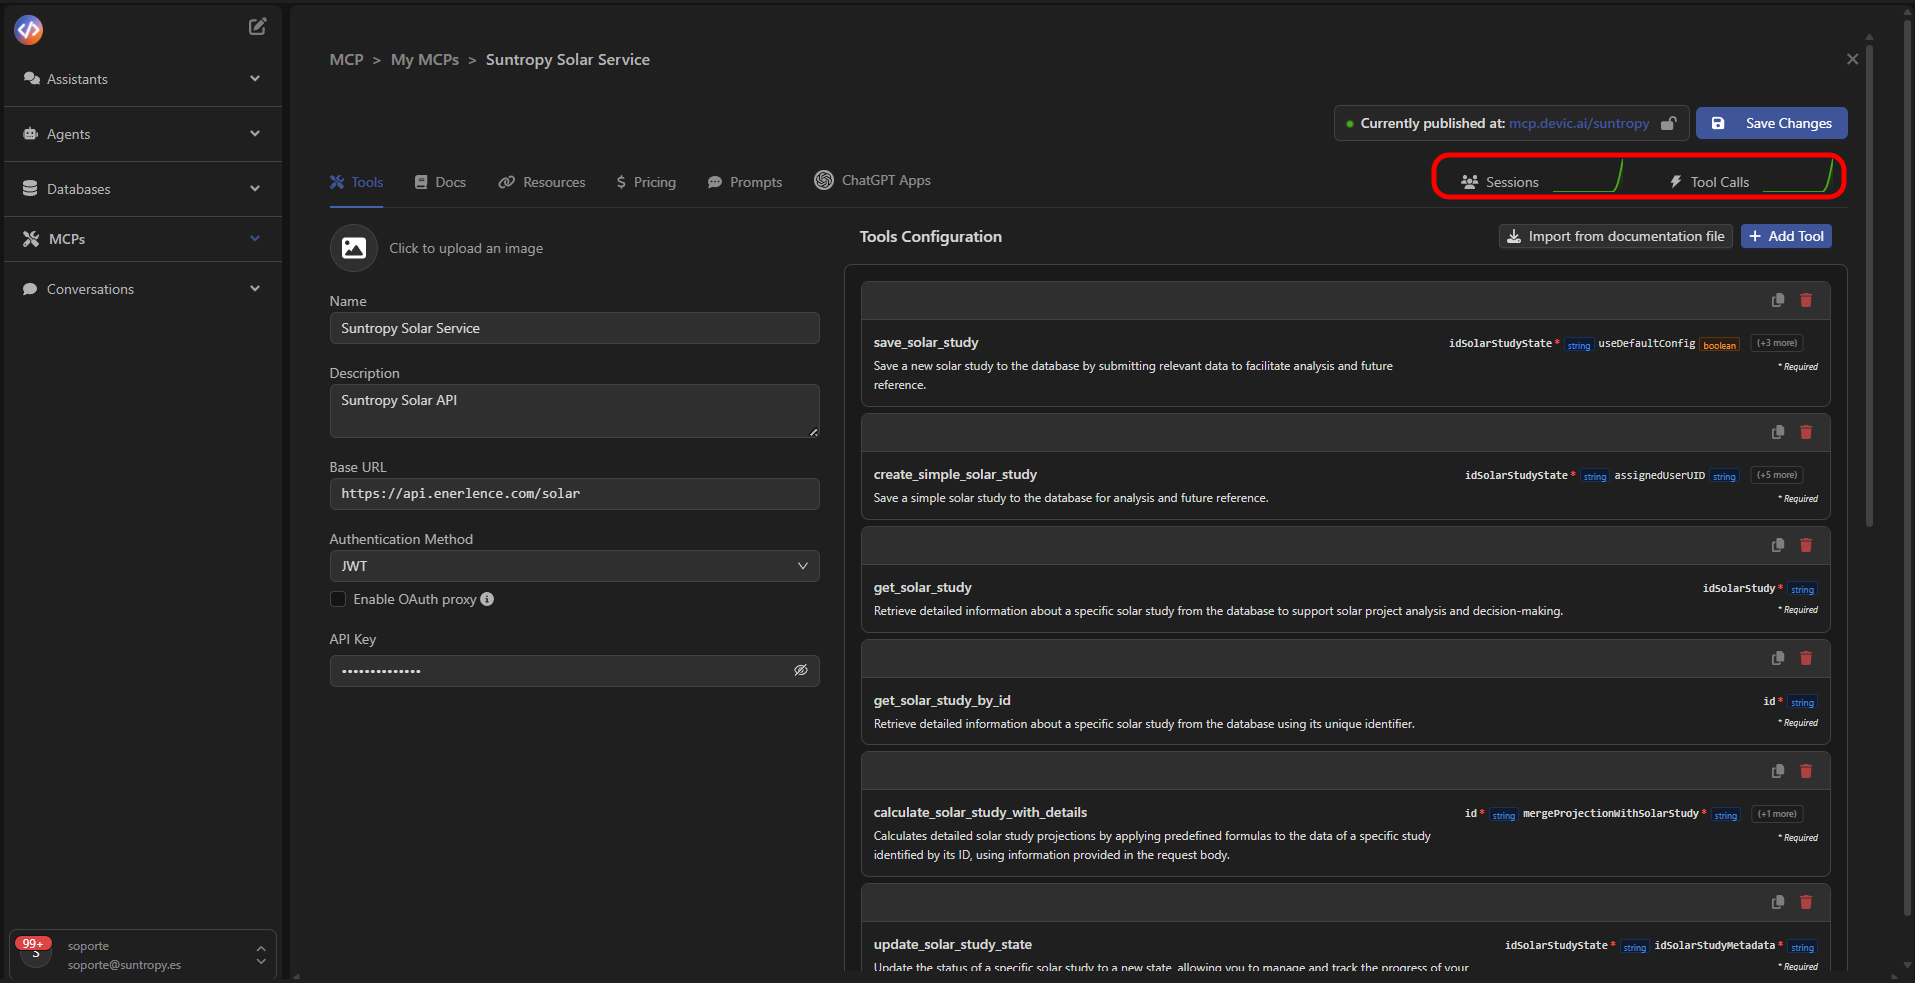
Sessions Panel
Once your MCP is published, you can access the Sessions tab to monitor in real time how agents or external services are interacting with your tools.From this panel, you can see usage statistics, average session duration, and details about each active connection.
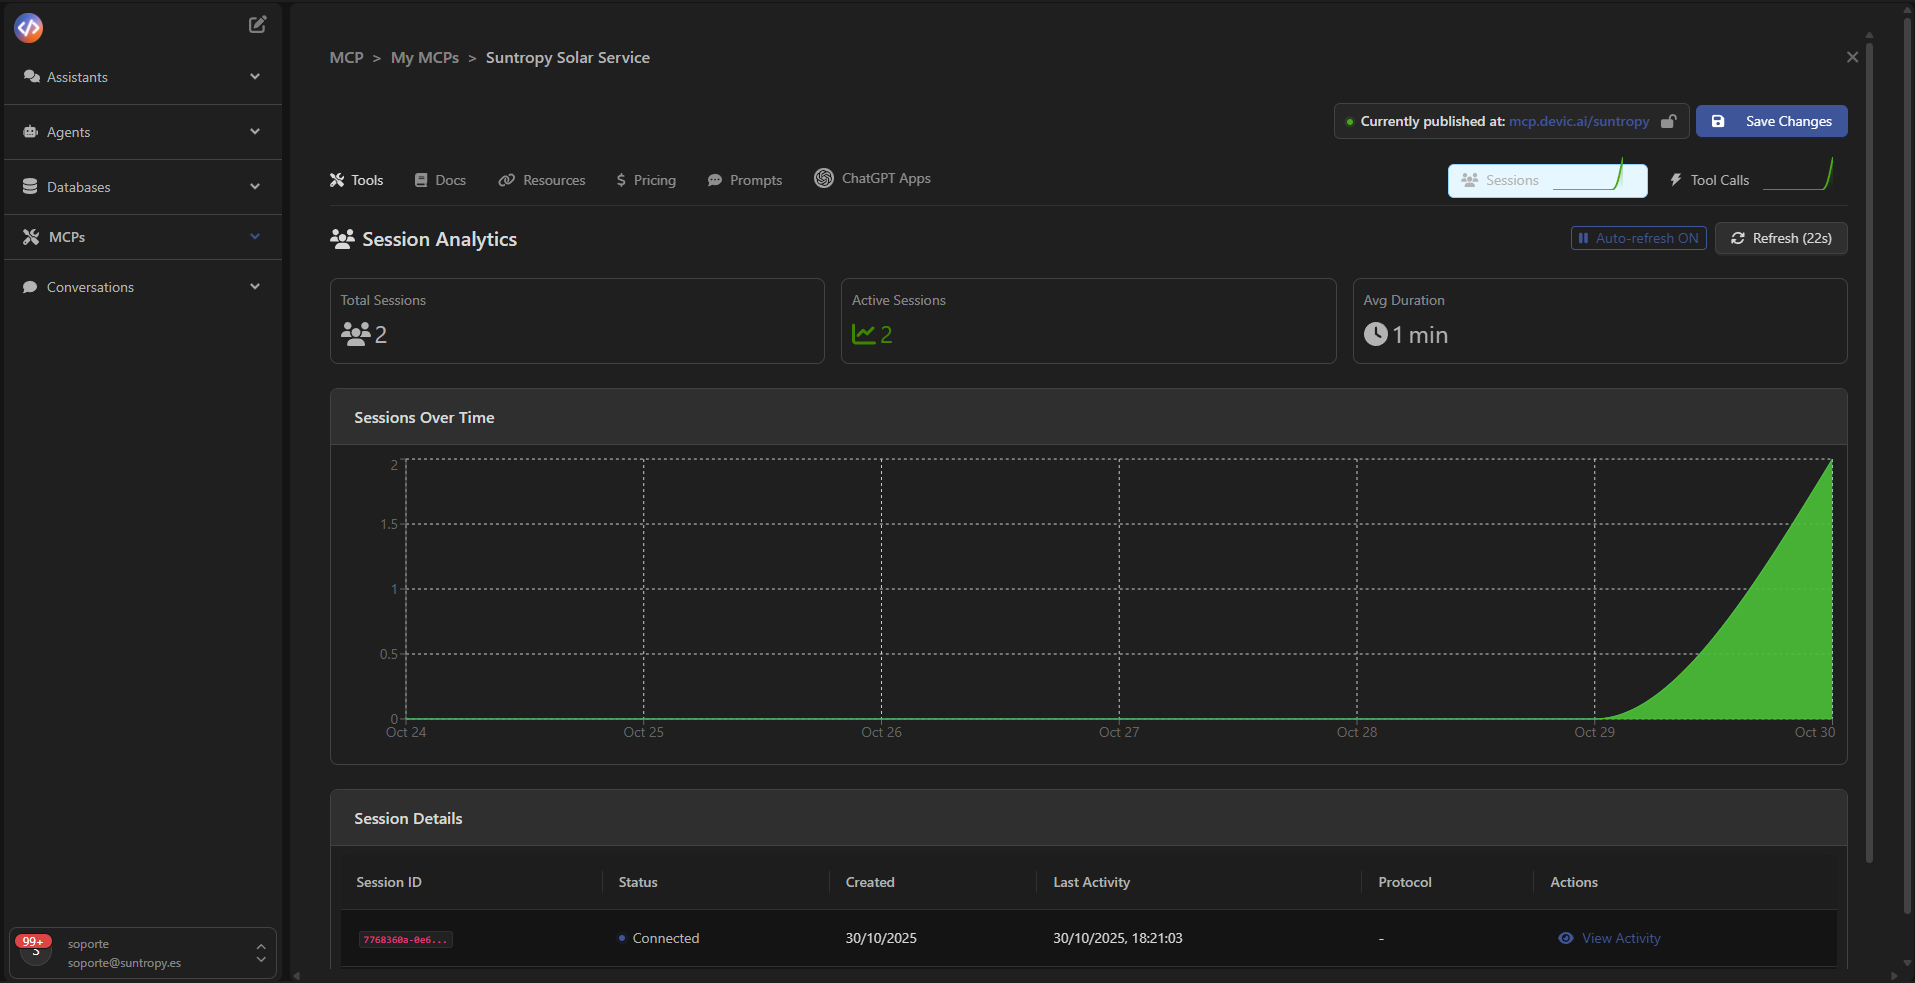
Session Analytics
At the top of the panel, you’ll find the main indicators:- Total Sessions: total number of sessions created.
- Active Sessions: how many sessions are currently active.
- Avg Duration: average duration of active sessions.
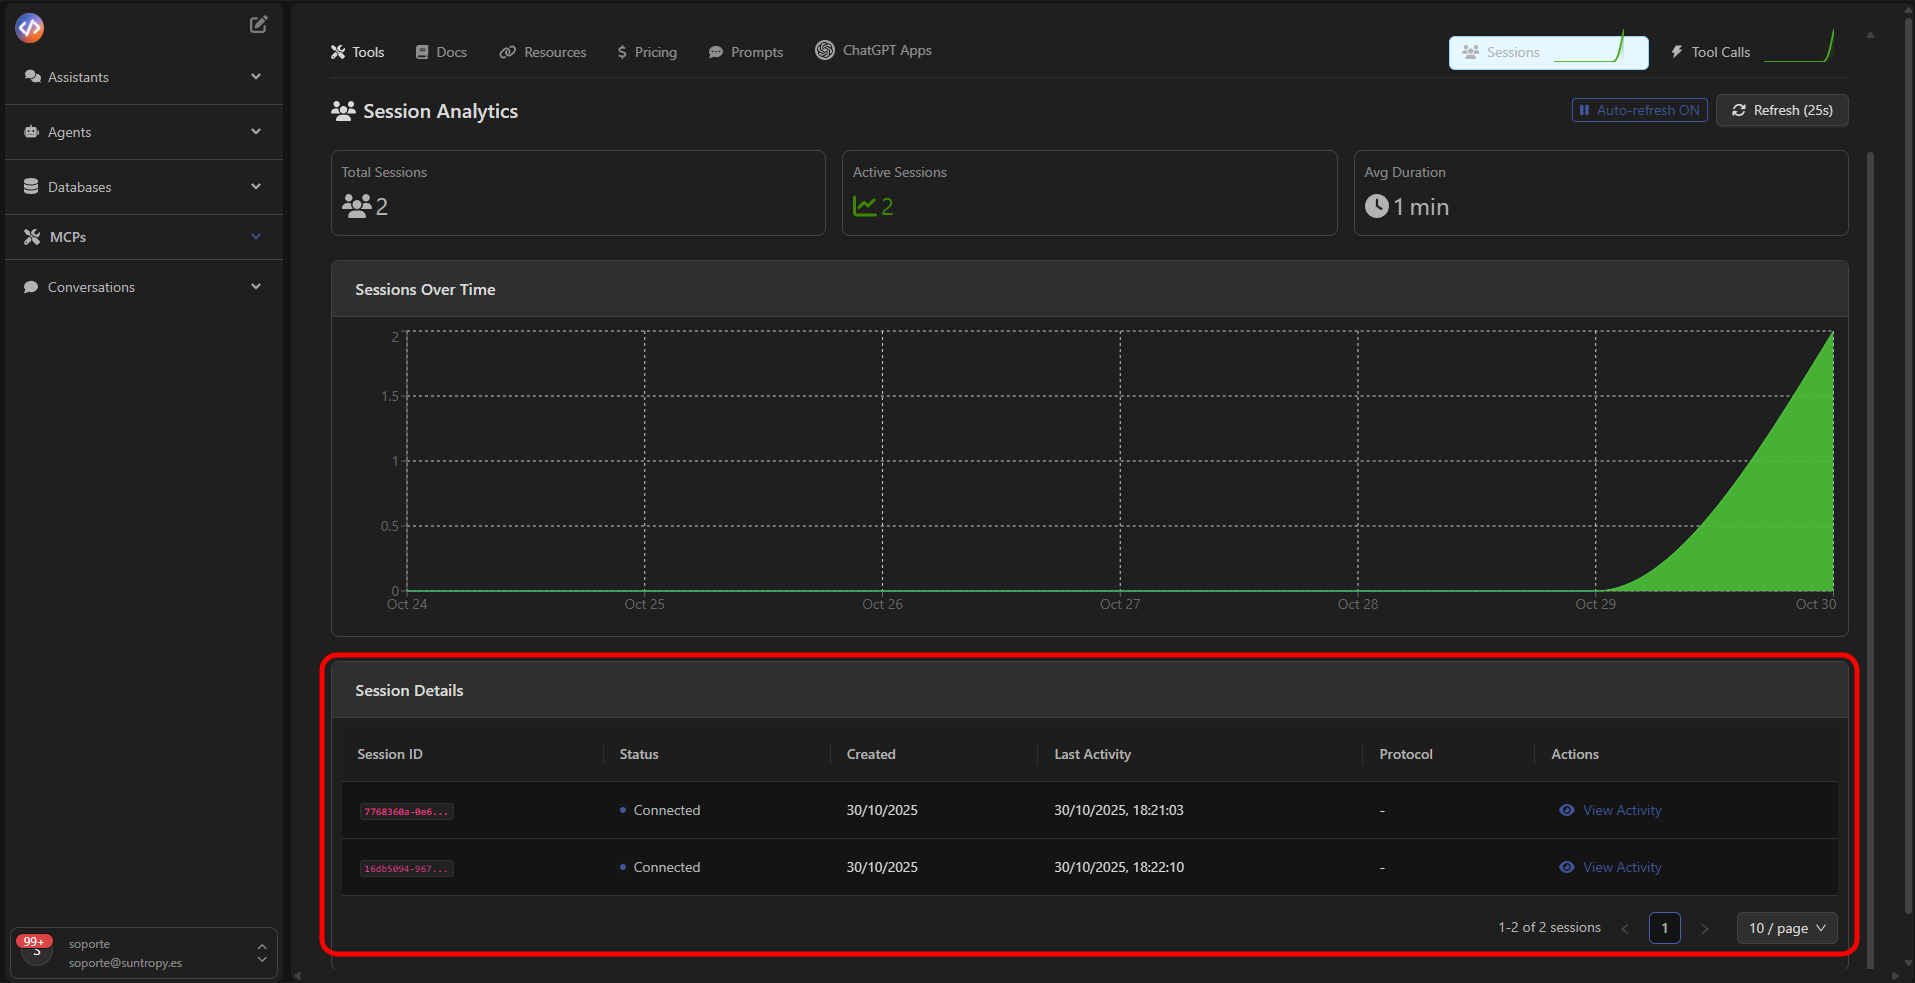
Session Details
Below the chart, the Session Details table lists all connections made to the MCP. Each row includes:- Session ID: unique identifier of the session.
- Status: current session status (e.g., Connected).
- Created / Last Activity: timestamps of creation and last interaction.
- Protocol: protocol used for the connection.
- Actions: button to inspect the session’s activity.
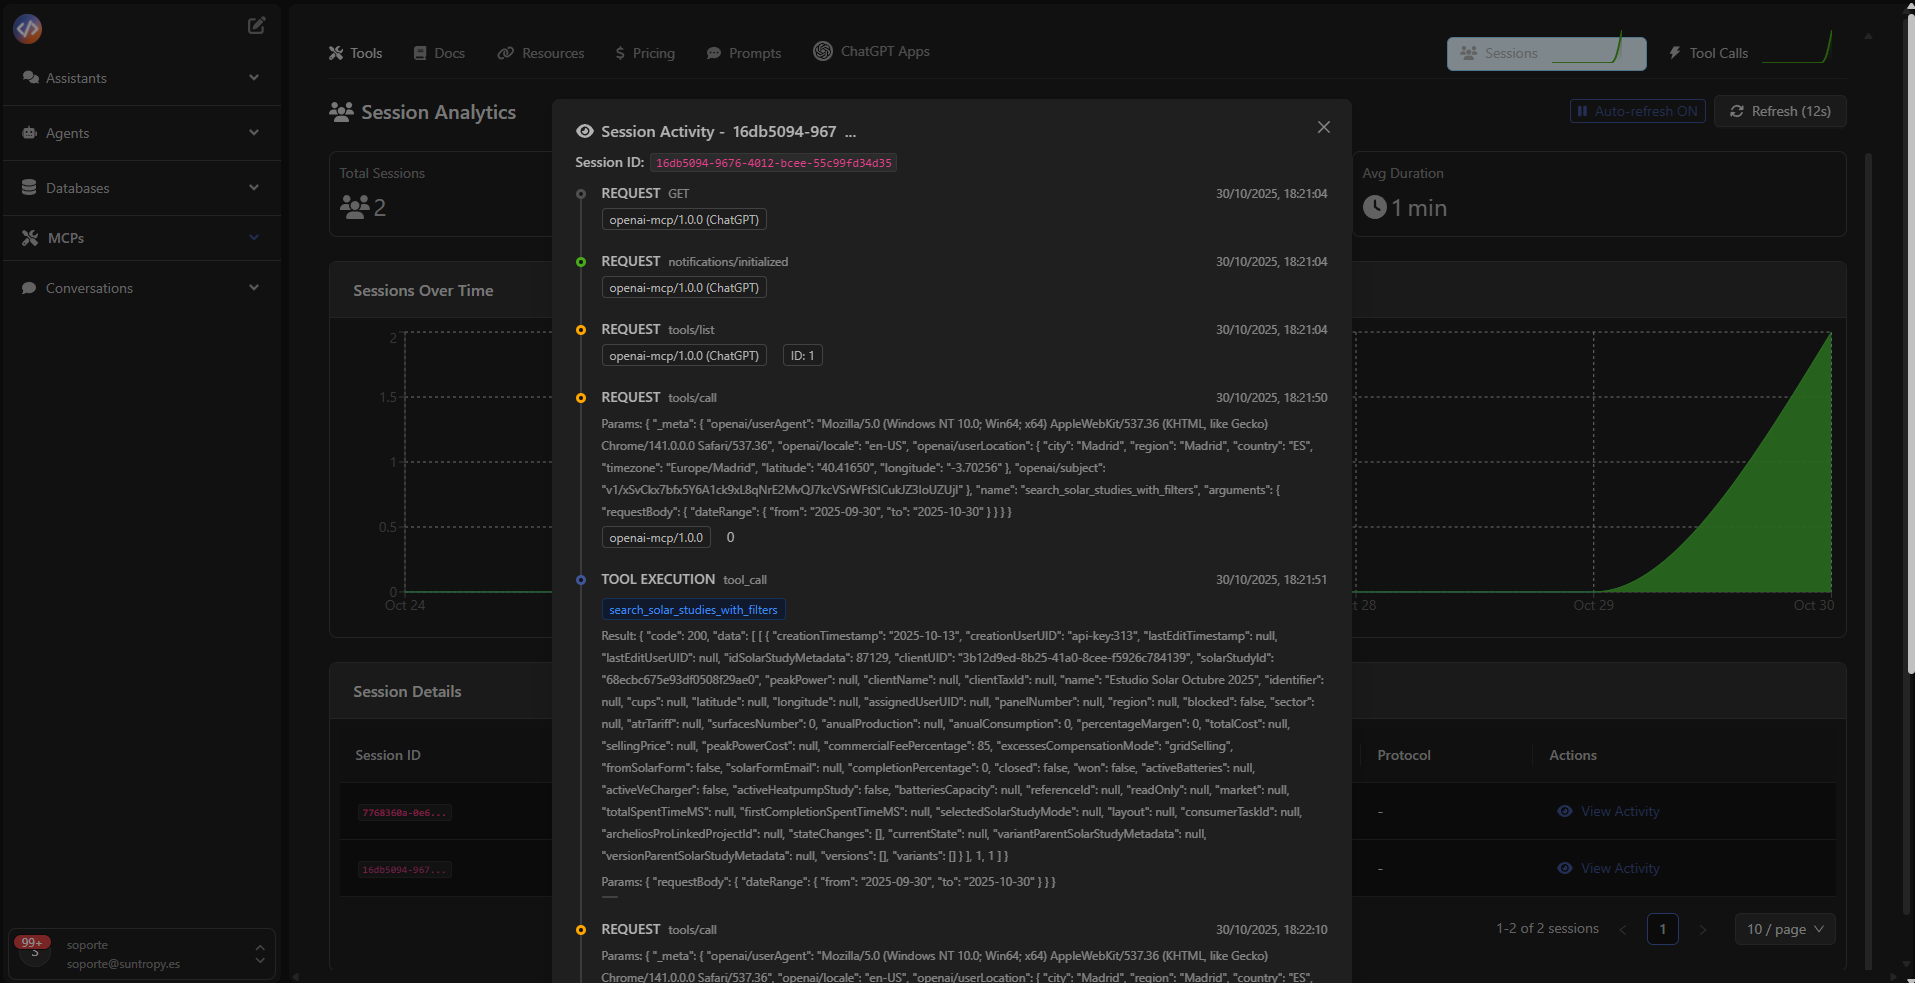
Detailed Session Activity
Clicking View Activity opens the Session Activity panel, where you can inspect each interaction within the session, including:- REQUESTS made by the client or agent.
- TOOL EXECUTIONS triggered.
- Results and any error messages returned.
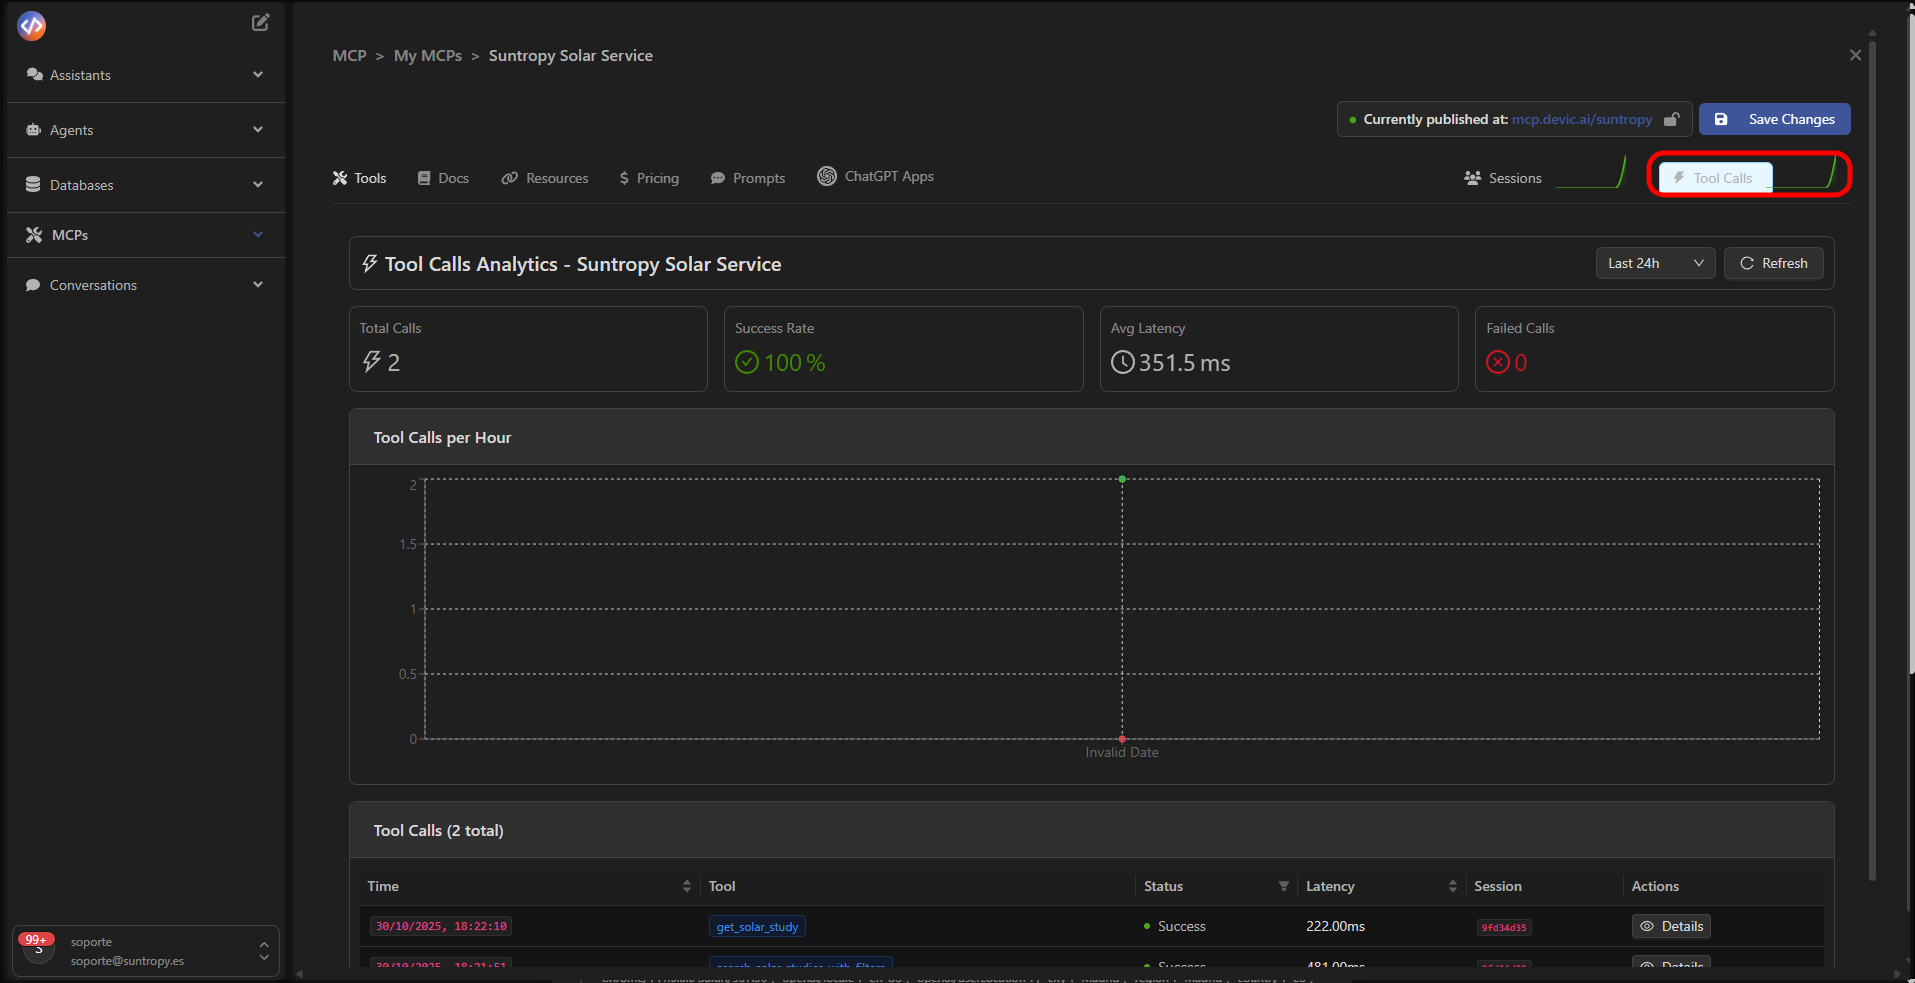
Tool Calls Analytics
In the Tool Calls tab, you can analyze the performance of your tools within the MCP.Key metrics include:
- Total Calls: total number of executions.
- Success Rate: percentage of successful executions.
- Avg Latency: average response time.
- Failed Calls: executions that resulted in an error.
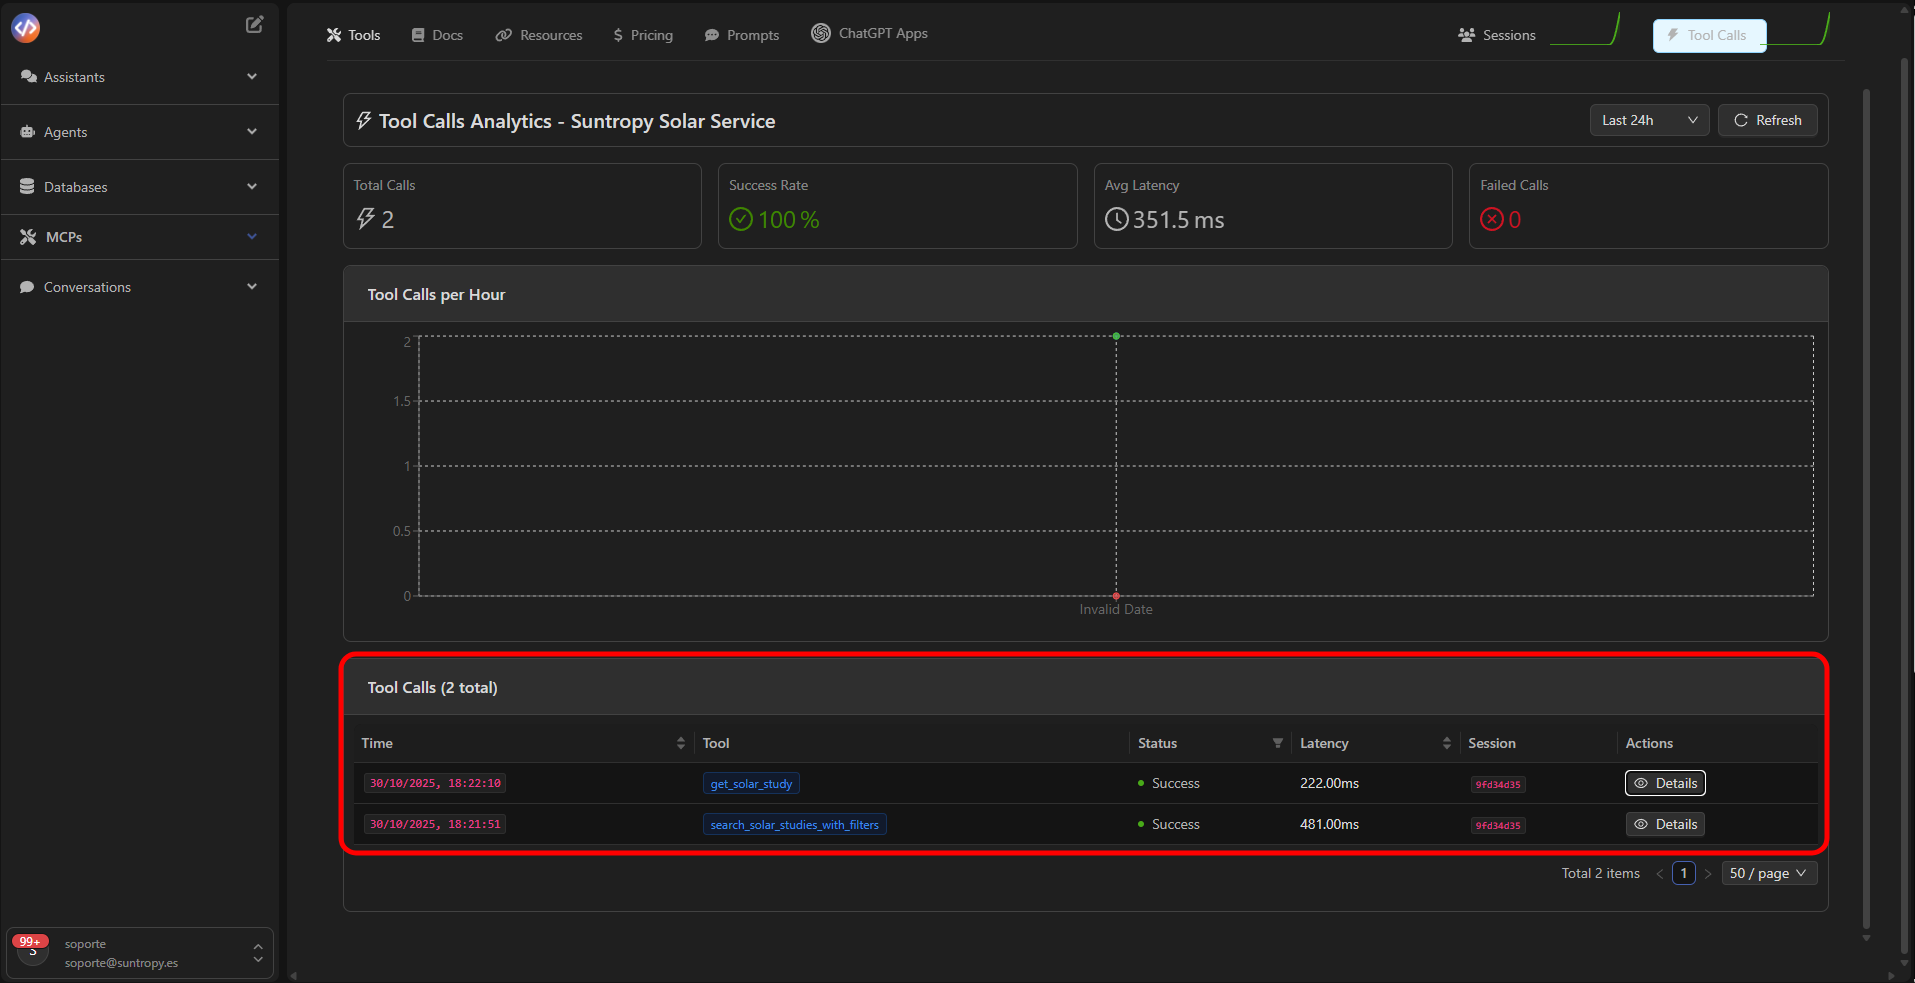
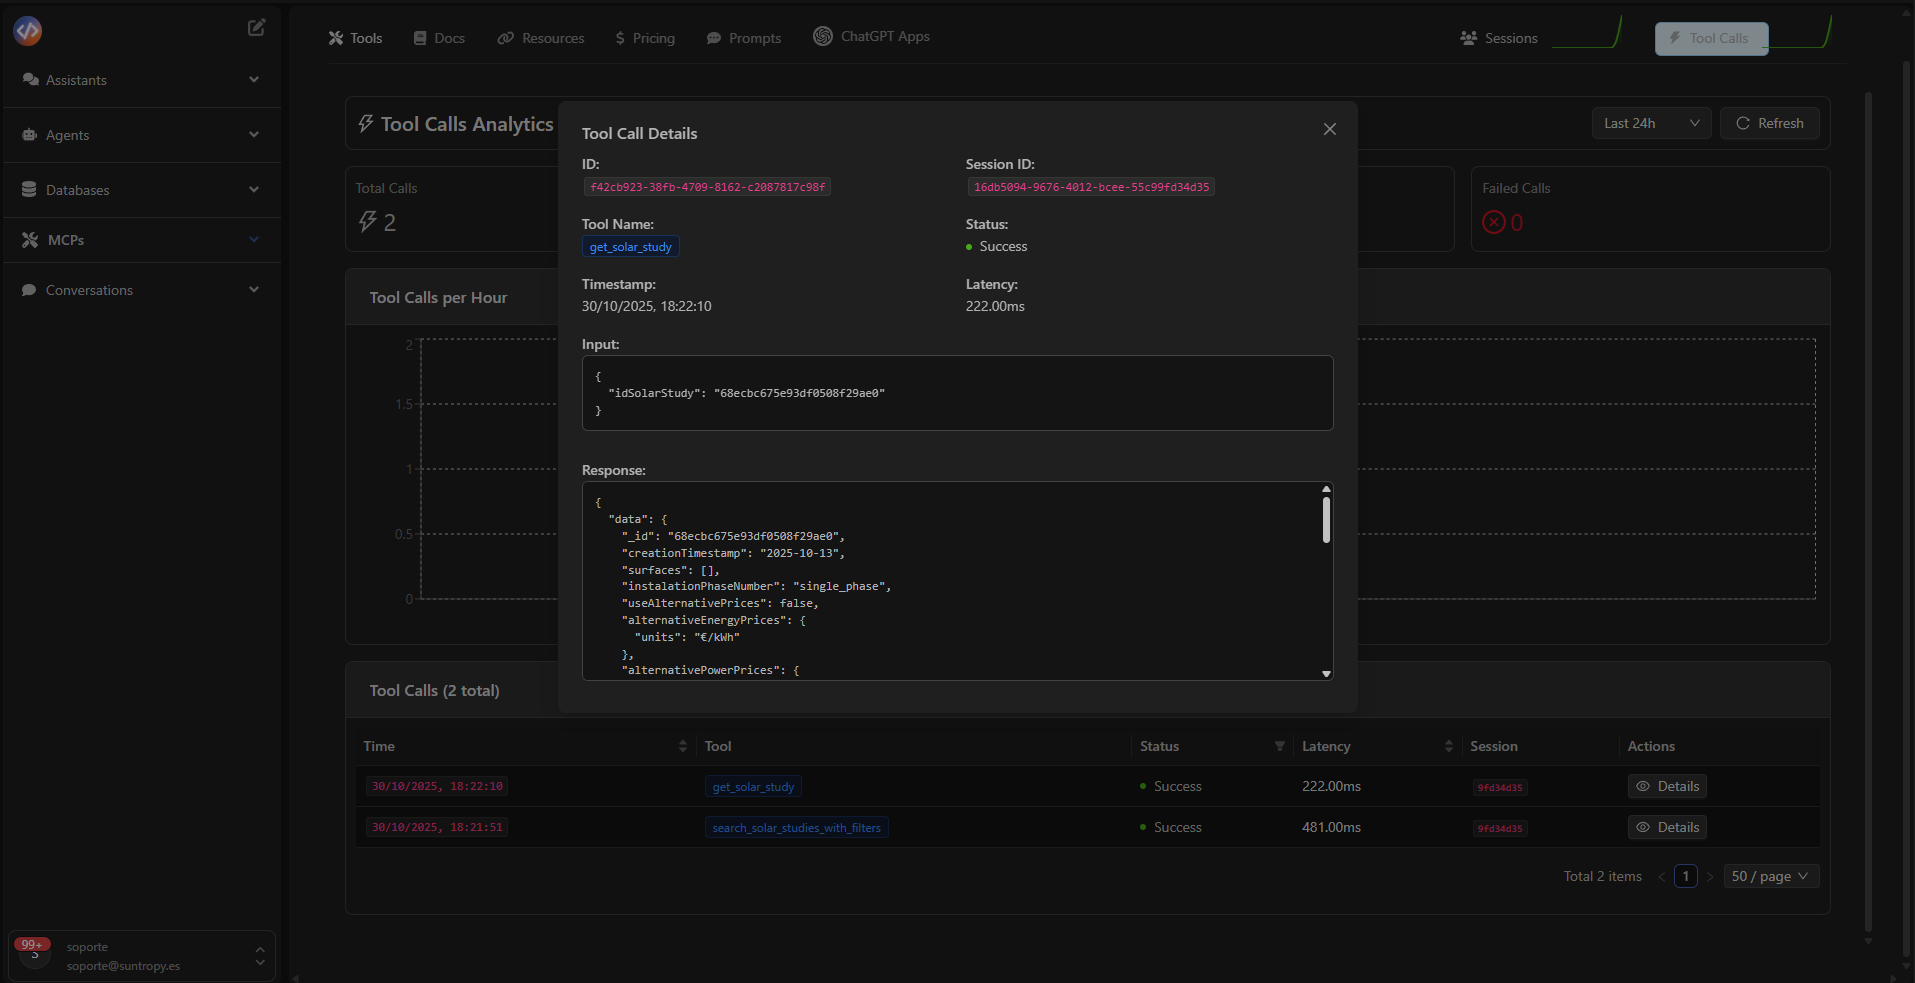
Execution History
The lower table displays all recorded tool calls, including:- Exact execution time
- Tool used
- Status (Success / Failed)
- Measured latency
- Associated session
Next step
Learn how to create your own widgets to integrate with ChatGPT when invoking your MCP.